Notice: On April 23, 2014, Statalist moved from an email list to a forum, based at statalist.org.
[Date Prev][Date Next][Thread Prev][Thread Next][Date Index][Thread Index]
RE: st: AW: Artmenu fails to load in Stata 11
From
"Martin Weiss" <[email protected]>
To
<[email protected]>
Subject
RE: st: AW: Artmenu fails to load in Stata 11
Date
Wed, 19 May 2010 00:21:04 +0200
<>
Jonathan can attach a
***********
ylab(#5)
***********
to the very end of the -stpower- call to get the original <
http://www.stata.com/stata10/i/ex3fix_big.gif > "0.2" delta for the y-axis
labels...
HTH
Martin
-----Original Message-----
From: [email protected]
[mailto:[email protected]] On Behalf Of Yulia Marchenko,
StataCorp LP
Sent: Dienstag, 18. Mai 2010 23:59
To: [email protected]
Subject: Re: st: AW: Artmenu fails to load in Stata 11
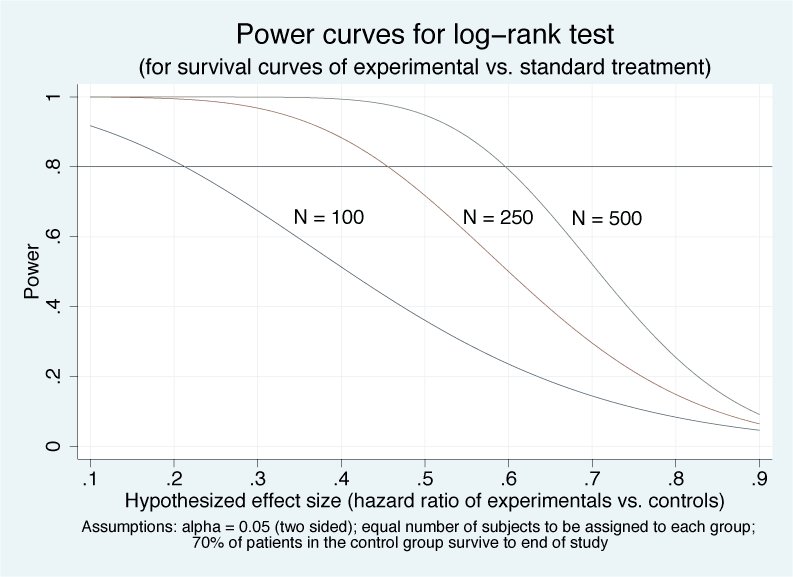
Jonathan Kaplan <[email protected]> asks how to reproduce a power-curve
graph depicted on the Stata website:
> I am trying to reproduce the graph displayed in:
>
> http://www.stata.com/stata10/poweranalysis.html
>
> I'm able to reproduce the basic data using
>
> . stpower logrank 0.7, n(100 250 500) hratio(0.1(0.01)0.9) saving(mypower)
>
> However I cannot figure the correct syntax to produce the graph.
Martin Weiss <[email protected]> showed a manual way of obtaining a graph
after -stpower-
(http://www.stata.com/statalist/archive/2010-05/msg01016.html). Jonathan
can
also use the unofficial command -stpowplot- to obtain power curves for the
log-rank test more easily. For example,
. stpowplot logrank 0.7, yaxis(power) xaxis(hr) over(n) ///
n(100 250 500) hratio(0.1(0.01)0.9)
will produce a graph similar to that displayed on the webpage. Following
Martin's suggestions, Jonathan can customize the graph to obtain a closer
match:
/*** begin example ****/
local title Power curves for log-rank test
local subtitle (for survival curves of experimental vs. standard treatment)
local note1 Assumptions: alpha = 0.05 (two sided); equal number of subjects
local note1 `note1' to be assigned to each group;
local note2 70% of patients in the control group survive to the end of the
study
local xtitle Hypothesized effect size (hazard ratio of experimentals vs.
controls)
stpowplot logrank 0.7, yaxis(power) xaxis(hr) over(n) ///
n(100 250 500) hratio(0.1(0.01)0.9) ///
title(`title') subtitle(`subtitle') ///
note("`note1'" "`note2'") ///
xtitle(`xtitle') yline(0.8, lstyle(refline)) ///
legend(off) text(.65 .4 "N = 100") ///
text(.65 .6 "N = 250") text(.65 .75 "N = 500")
/*** end example ****/
Type
. findit stpowplot
to locate and install this command.
-- Yulia
[email protected]
*
* For searches and help try:
* http://www.stata.com/help.cgi?search
* http://www.stata.com/support/statalist/faq
* http://www.ats.ucla.edu/stat/stata/
*
* For searches and help try:
* http://www.stata.com/help.cgi?search
* http://www.stata.com/support/statalist/faq
* http://www.ats.ucla.edu/stat/stata/