|
[Date Prev][Date Next][Thread Prev][Thread Next][Date index][Thread index]
st: normality and heteroskedasticity in truncreg
Dear Statalist Members
I am estimating a truncated regression with truncreg. My y-Variable is
truncated (400 of 1700 observations) and highly skewed to the right,
so I transformed using the logarithm.
Now I would like to test for Heteroskedasticity and Normality. I did
not find any tests.
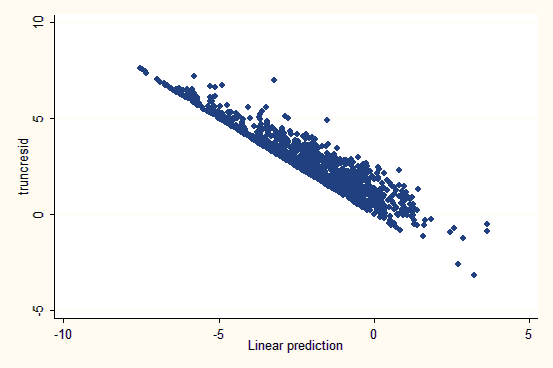
I tried to analize the residuals graphically by
predict, xb
gen residual=y-xb, where y ist my observation and xb is the fitted value.
By plotting the residuals against the fitted values, I found a graph
with a slope of -1, above this, there are also some observations
(graph ist attached).
How can I interpret this, or is there a better way to interpret
truncated regression residuals for heteroscedasticity? Why are there
so many negative fitted values? May be I made a mistake calculating
the residuals
I also tried to follow the graphical analysis for normal regression
for Normality using qnorm and pnorm, but i am not shure if this is
appropriate, as this is not a linear estimation.
Can anyone help me please?
I am very sorry, if this is a silly question
Anita