

How do you compare? Examining effects in multilevel models using contrasts
If your statistical background includes ANOVA modeling and analysis of designed experiments, you are likely already familiar with contrasts. If not, contrasts may be a new concept, or perhaps you use certain types of contrasts but call them by different names. So before we jump to contrasts with multilevel models, let’s look at a few types of tests you can perform using Stata’s contrast command.
Making comparisons using contrast
As with the example data in Keppel and Wickens (2004, chapter 13), let’s suppose we have fifth-grade students who are asked to learn a set of vocabulary words and are tested on them a week later. We are interested in comparing three teaching methods and four types of words. When teaching, the teacher provides no verbal feedback, positive feedback, or negative feedback. The four word lists are categorized by the frequency with which the words are used, where freq=1 corresponds to words least frequently used and freq=4 corresponds to words most frequently used.
Let's start by regressing vocabulary test score on the frequency categories.
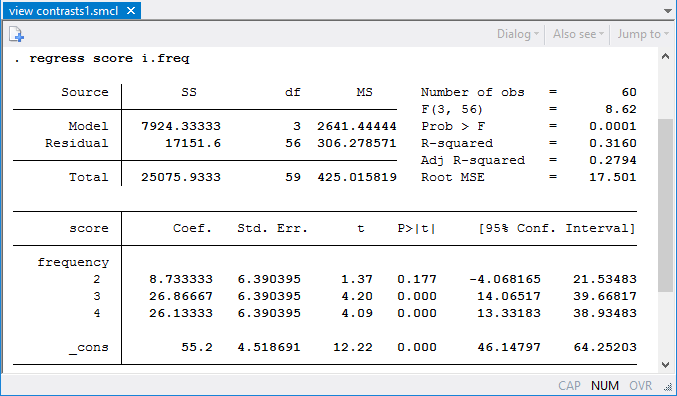
The coefficients in the regression output are one type of contrast—comparisons with the base level of least frequently used words. Mean test scores for the third and fourth frequency levels are statistically greater than those for the first (base) level. However, it would be nice to know whether differences exist for each increase in word frequency level. Are there differences between the second and third levels? Between the third and fourth levels? We can use the ar. contrast operator to make these “reverse adjacent” comparisons.
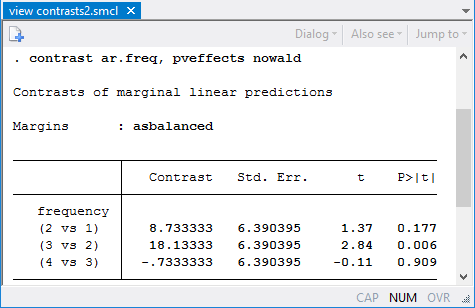
Here we find that the change from level 2 to level 3 is the only one with a statistically significant difference in estimated mean scores.
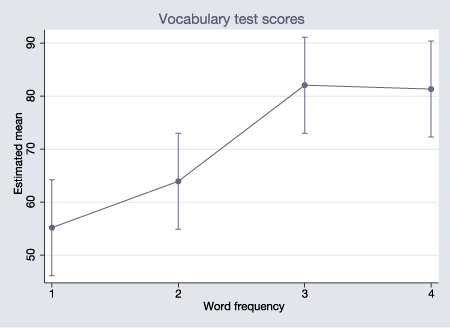
We can see this large jump when we plot the estimated means using margins freq followed by the marginsplot command.
Now, let’s fit a model allowing for an interaction between frequency and type of feedback by typing
. regress score freq##feedback
(output omitted)
We can use contrast to obtain tests of the main and interaction effects.
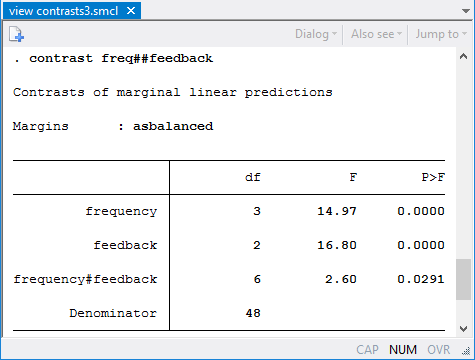
We have statistical evidence for an interaction effect, but at this point, we can’t say much about where differences exist. A plot allows us to visualize the interaction.
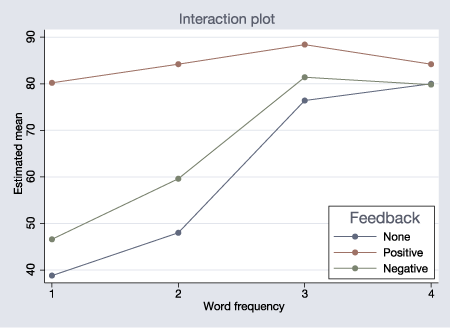
We can test specific hypotheses about the relationship between word frequency and teaching method. For example, when positive feedback is given, feedback=2, does word frequency have an effect?
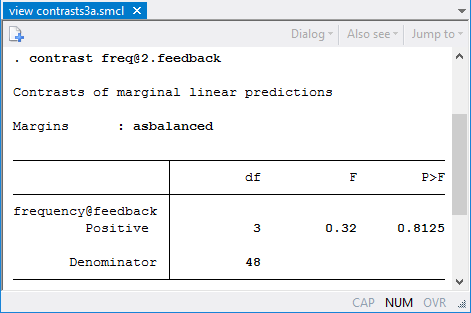
There is no statistically significant difference in the four means for this teaching method.
We can also test whether there is an effect of teaching method at individual frequency levels.
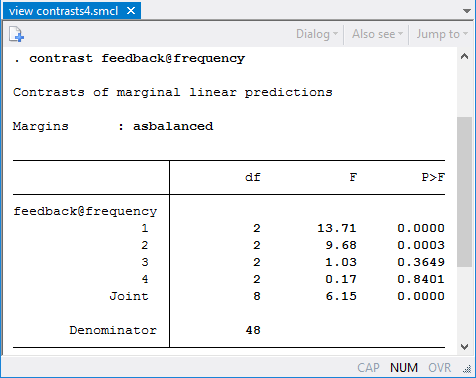
For the first and second frequency levels (but not the third and fourth), there is a statistical difference in the estimated means for the different teaching methods.
Is there really any interaction if we consider only the change from the first to second frequency level?
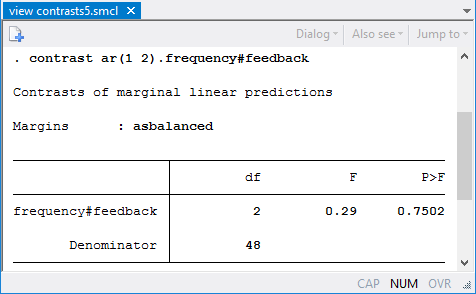
We do not find evidence of an interaction effect at these frequency levels.
Multilevel models
We can easily apply the same types of contrasts when fitting multilevel models. For example, suppose that each student was tested multiple times. We can fit a random-effects model allowing for student-level variation in the intercepts and perform the same types of contrasts. To do this, we could type
. mixed score feedback##freq || id:
. contrast feedback##freq
. contrast feedback@frequency
However, acknowledging that we have repeated measurements on students and a fairly small sample size, we request that both mixed and contrast report small-sample tests using a repeated-measures ANOVA method for computing denominator degrees of freedom.
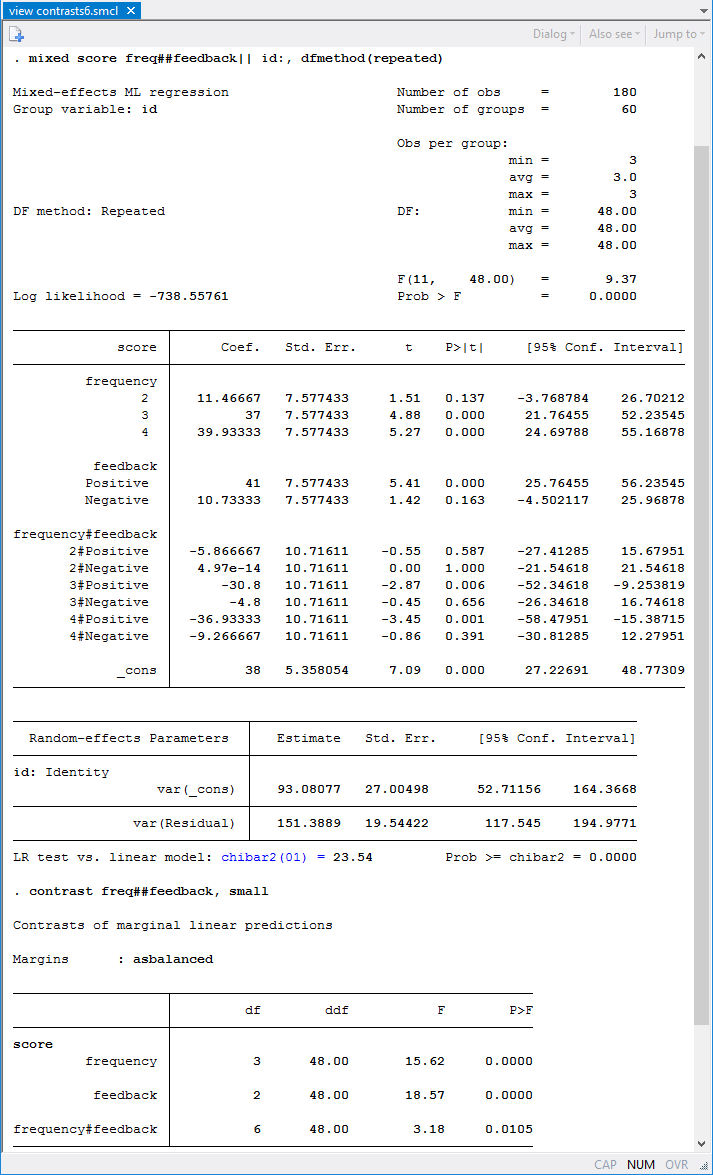
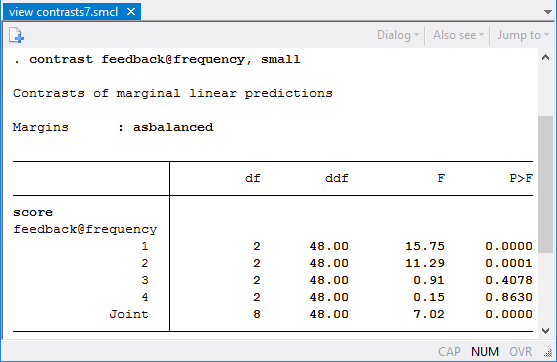
As before, we find an interaction between the type of feedback and the frequency of word use. Using the contrast command below, we also find that the simple effects of feedback exist only for the lower-frequency words.
And beyond
We have considered fairly traditional experimental design applications. However, the use of contrast is not so limited. contrast can be used after fitting most models in Stata. Options are available for working with unequal group sizes and for adjusting results for multiple comparisons. Find details on these and many other extensions in [R] contrast.
—Kristin MacDonald
Asst. Director of Statistical Services
Reference
Keppel, G., and T. D. Wickens. 2004. Design and Analysis: A Researcher’s Handbook. 4th ed. Upper Saddle River, NJ: Pearson.


