
1 item has been added to your cart.
Our command language is so intuitive you will begin to predict what you can type, even for commands you have never run.
Most commands have a similar syntax, whether the command fits a model, produces descriptive statistics, creates a graph, or performs a data management task:
. summarize age income
. tabulate age
. logit outcome gender status exp if age>29

. scatter income educ if state=="Texas"
. drop if age <= 29

. by gender: tabulate case exposure
. by agegrp: summarize income yrswk
But you are not required to type commands.
Stata also has an easy-to-use point-and-click interface providing access to every data management, graphical, and statistical feature in Stata.
Stata supports all your statistical needs—from linear regression to dynamic panel data, from t tests to multiple imputation, from generalized linear models to Bayesian analysis, from ARIMA to unobserved component models, from cross tabulations to item response theory, from case control to survival analysis, from factor analysis to SEM, from confidence intervals to complex survey analysis, and from GEE (generalized estimating equations) to GMM (generalized method of moments estimation).
Read the full list of features.
Stata’s data management features give you complete control over all types of data—cross-sectional, time series, longitudinal, survival, multilevel, imputed, survey, and more. Read more.
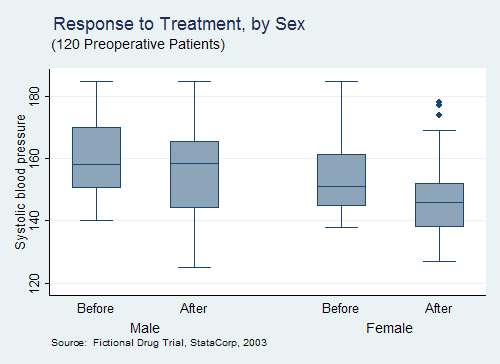
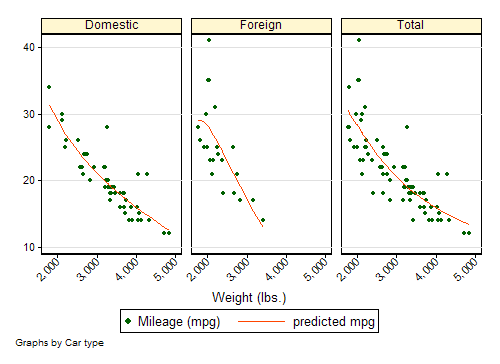
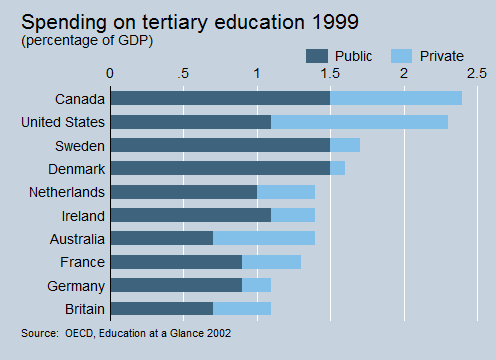
Create fully customizable, publication-quality graphs from intuitive dialog boxes or using predictable command syntax. Or create a basic graph and customize it using the Graph Editor. You can even create a scheme so that all of your graphs share a common custom style.
See some examples. Learn how easy it is to create fundamental graph types. Or read an overview of the features.
Stata takes full advantage of today’s multicore computers to give the fastest possible performance. Read more on Stata/MP, or go straight to the white paper.
Stata includes both a scripting language for analysis and a compiled matrix-programming language, Mata, for implementing your own estimators and for large-scale development. Stata is so programmable that developers and users add new features every day to respond to the growing demands of today’s researchers.

 |

Stata is not sold in modules, which means you get everything in one package: unparalleled statistical breadth; easy, powerful data management; outstanding graphics; matrix programming; and more.
Stata runs on Windows, Mac, and Linux/Unix computers. Your Stata license is not platform specific. This means that if you have a Mac laptop and a Windows desktop, you don't need two separate licenses to run Stata. And your Stata datasets, programs, and other data can be shared across platforms without translation.
Stata comes with complete documentation that provides comprehensive overviews of every statistical procedure and examples with data that you can run and extend.
We even offer our registered users free technical support from master and PhD statisticians.
No other statistical package is more complete.


